A graph is such a great tool. It can tell a story and it does not editorialize. The ingredients of a graph are just facts — nothing more, nothing less.
A couple of weeks ago the mayor of Binghamton, NY, Matthew Ryan, announced that he was going to put a “cost of war” sign on the outside of Binghamton City Hall. Reading about his plans, one of my colleagues quipped, “What about the war on poverty and the war on drugs, those wars we seem to be losing.”
A graph is definitely in order, one graph turned into three and tell a story.


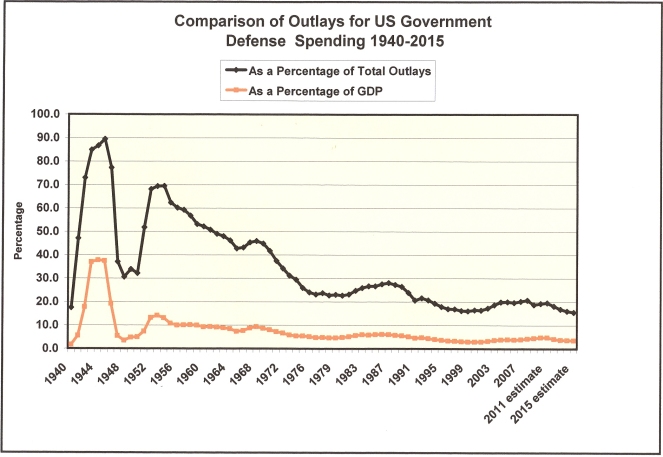
Please take note that on the first graph government spending for defense has steadily declined since the late 1950’s.
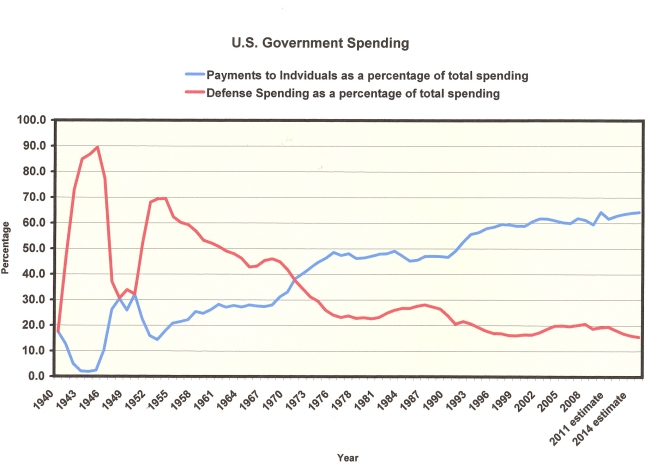
Note that on the second graph in 1971 (7 years after President Johnson announced a “War On Poverty” in conjunction with his Great Society) that payments for individuals intersected with defense spending.
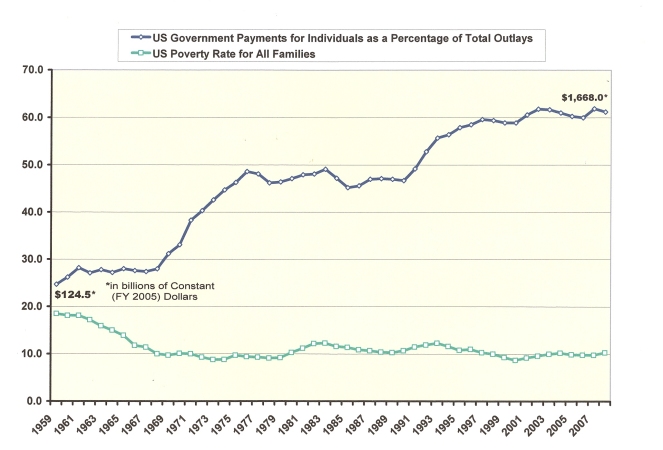
Finally on the third graph please note that the poverty rate steadily decreased from 18.5 percent in 1959 to 9.7 percent in 1969 and has hovered around 10 percent ever since. This graph also shows the trend of government payments for individuals as a percent of all government outlays. In constant dollars those payments increased from $124.5 billion in 1959 to $1,668 trillion in 2008 or 61.2% of the total outlays. As the poverty rate remained static, government spending for individuals increased at a staggering rate of over 1200%.
So — are we winning the war on poverty? Graphs don’t editorialize, they allow you to draw conclusions.
